GROMACS Tutorial
Step Seven: Data Analysis
|
The most common analysis conducted for umbrella sampling simulations is the extraction of the potential of mean force (PMF), which will yield the ΔG for the binding/unbinding process. The value of ΔG is simply the difference between the highest and lowest values of the PMF curve, as long as the values of the PMF converge to a stable value at large COM distance. A common method for extracting PMF is the Weighted Histogram Analysis Method (WHAM), included in GROMACS as the wham module. The input to wham consists of two files, one that lists the names of the .tpr files of each window, and the other that lists the names of either the pullf.xvg or pullx.xvg files from each window. For example, a simple tpr-files.dat might consist of: umbrella0.tpr umbrella1.tpr ... umbrella22.tpr And analogously for the list of pullf.xvg or pullx.xvg files, in either pullf-files.dat or pullx-files.dat. Note that the files must have unique names (i.e., umbrella0_pullf.xvg, umbrella1_pullf.xvg, etc) or else wham will fail. List the files in pullf-files.dat in the same manner as tpr-files.dat: umbrella0_pullf.xvg umbrella1_pullf.xvg ... umbrella22_pullf.xvg We then run gmx wham: gmx wham -it tpr-files.dat -if pullf-files.dat -o -hist -unit kCal The wham module will then open each of the umbrella*.tpr and umbrella*_pullf.xvg files sequentially and run the WHAM analysis on them. The 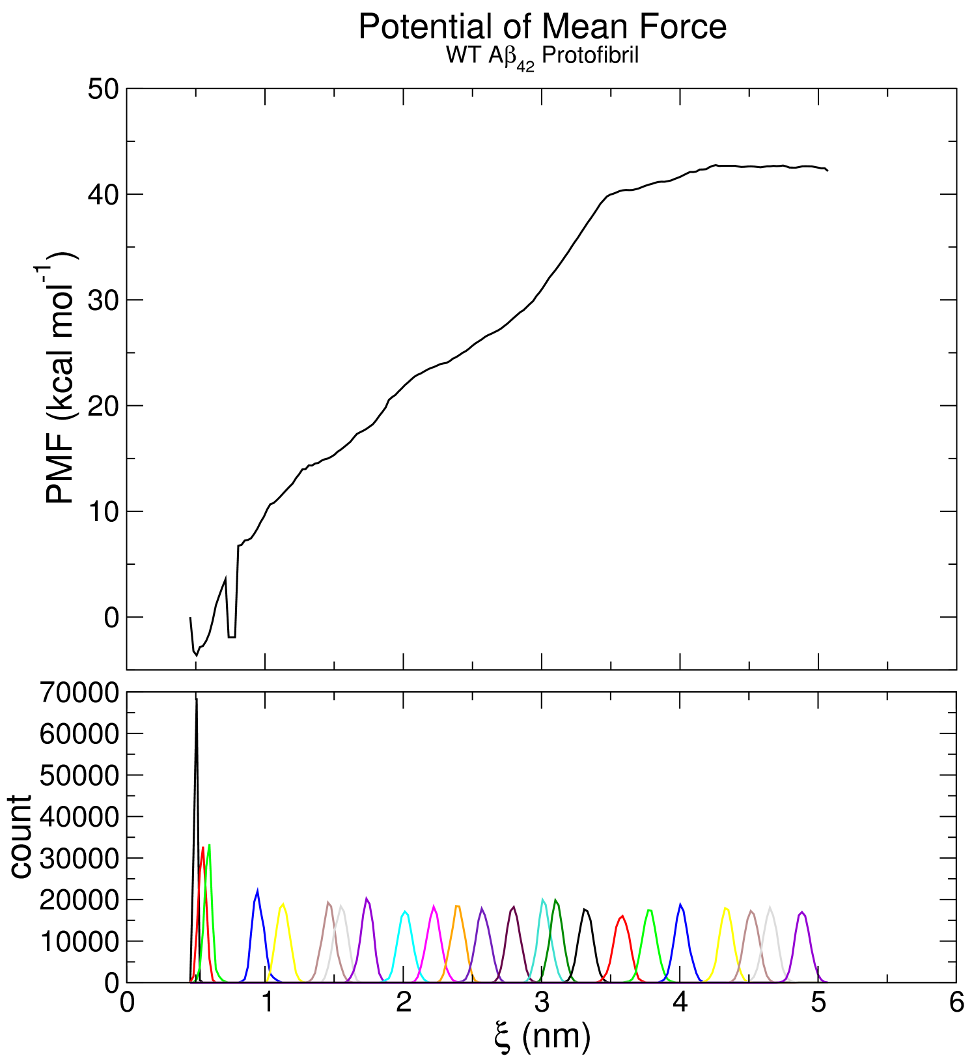
The result obtained here corresponds to ΔG = 46 kcal mol-1, comparable to our published value of 50.5 kcal mol-1. Some difference is expected since the window spacing was not identical and the starting configuration was different. Note in particular that there is a defect in the PMF profile around ξ = 0.8 nm, reflecting a lack of sampling that is apparent in the histograms. This region of ξ is a high-energy state, and since there was no window centered on this region of the reaction coordinate, sampling was inadequate. To fix this problem, carry out an additional simulation with a window centered at ξ = 0.8 nm. As all of the umbrella sampling window simulations are independent, the others do not have to be re-run, just include the new umbrella.tpr and umbrella_pullf.xvg files in your WHAM input and re-run the WHAM analysis.
|
Site design and content copyright Justin Lemkul
Problems with the site? Send them to the Webmaster